
Analyzing Seismic Waves from Human Footfalls Using IoT Vibration Sensors and AI


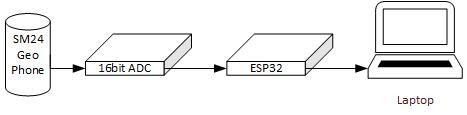
In this test, I used an ESP32 development board, an ADS1115 16-bit analog-to-digital converter, and an SM-24 geophone sensor to capture seismic signals generated by human footfalls.

Rather than relying on an external analog bandpass filter, which often introduces additional electrical noise. I implemented a digital bandpass filter directly on the ESP32 microcontroller. This software-based signal conditioning approach enabled more precise control over frequency filtering and reduced hardware complexity. The filter was designed to pass frequencies in the 5 Hz to 60 Hz range, which corresponds to the dominant frequency band of human footfall vibrations.

The complete sensor setup for footfall vibration acquisition is illustrated below:


Based on insights from prior research studies, the SM-24 geophone sensor exhibits higher accuracy and signal stability when buried at a depth of approximately 20 centimeters. To maximize seismic wave sensitivity, the sensor in this experiment was embedded 20 cm below the ground surface, ensuring optimal coupling with the earth for detecting footfall-induced vibrations.

The ESP32 microcontroller was connected to a computer via USB serial communication, functioning as the real-time interface for vibration data transmission. The ESP32 firmware was programmed to sample analog seismic signals from the SM-24 geophone using the ADS1115 16-bit ADC module at a sampling rate of 200 Hz. The digitized data was then streamed directly to the computer.

On the computer side, a Python-based data logger was employed to record incoming vibration signals and analyze seismic waveforms in the time domain. Special attention was given to identifying patterns and periodicity associated with human footfall activity, enabling classification based on signal peaks and their spacing.

The diagram below shows a time-domain seismic waveform recorded during a typical walking sequence. Each peak-trough cycle represents a vibration event generated by an individual footstep.


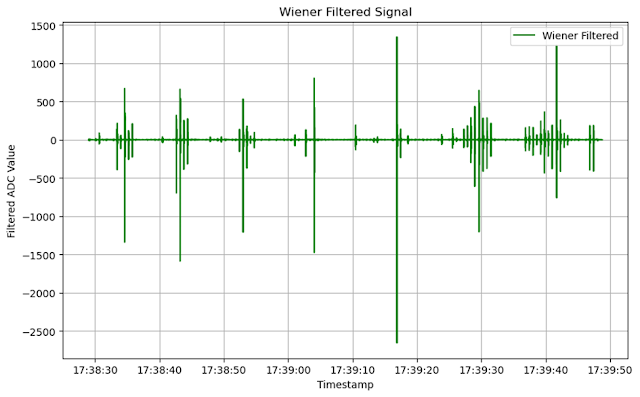
The raw seismic waveform captured by the geophone often contains background noise from environmental and electrical sources, which can mask the subtle patterns associated with human footfalls. To enhance the clarity of the signal and improve detection accuracy, I applied software-based noise reduction techniques. Several well-known digital filtering methods can be used for this purpose, including:

  • Wiener filtering – ideal for stationary noise environments
  • Median filtering – effective in removing spike-like anomalies
  • Wavelet-based denoising – powerful for isolating transient signals like footfalls

By applying these advanced signal processing algorithms, the resulting waveform shows a significant reduction in noise. As illustrated below, the enhanced seismic waveform provides a much clearer and more distinguishable representation of footfall-induced vibrations, making it more suitable for further analysis and AI-driven classification.


To identify the dominant frequency components associated with human footfalls, I conducted a series of controlled experiments. These tests were designed to analyze the frequency spectrum of seismic signals generated during walking activity using a geophone-based vibration sensing system.

By applying Fast Fourier Transform (FFT) and other spectral analysis techniques, the experiments aimed to pinpoint the most prominent frequency bands typically produced by footsteps. This frequency domain insight is crucial for developing AI-powered footstep classification systems and optimizing digital bandpass filters for improved detection accuracy.


By applying Discrete Fourier Transform (DFT) and spectrogram analysis, we can effectively uncover the dominant frequency components embedded in seismic signals produced by human footfalls. These frequency-domain visualizations reveal subtle patterns and periodic structures that are often hidden in raw time-domain waveforms.

This deeper level of spectral analysis provides the foundation for building automated footstep detection systems. The extracted frequency features can be utilized as input for machine learning and AI models, enabling real-time classification of human activity based on vibration data captured from the ground.

In the upcoming chapter, I will explore advanced signal processing techniques and demonstrate how to develop AI-driven algorithms for real-time footfall detection and activity recognition using seismic data collected from geophone sensors and IoT-enabled microcontrollers.

Comments

Most Popular Topics

Unboxing & Configuring Heltec ESP32 V3 LoRa Boards – Easy Peer-to-Peer Communication Setup

  LoRa (Long Range) is a wireless communication technology designed for long-distance, unlicensed frequency, low-power data transmission. It’s widely used in IoT (Internet of Things) applications where devices need to send small amounts of data over several kilometers without relying on Wi-Fi or cellular networks. With its low power consumption and extended range, LoRa is ideal for smart agriculture, environmental monitoring, and remote sensing projects. In this guide, I’ll walk you through my LoRa implementation setup using the Heltec ESP32 V3 boards. If you haven’t already installed the Arduino IDE on your computer, make sure to install it first. it’s essential for uploading code to your LoRa boards. Once the Arduino IDE is successfully installed, it should look like the screenshot below (or similar depending on your version). From there, follow the steps outlined in this tutorial to configure your boards for peer-to-peer communication. For this project, I used two Heltec ESP32 V...

ESP32 with Neo-6M GPS Module: Hardware Serial Code & Practical Implementation Guide

In this project, I used the ESP32 WROOM-32 development board in combination with the Neo-6M GPS module to acquire real-time satellite-based location data. The hardware components were interconnected using hardware serial (UART) to ensure reliable communication between the ESP32 and the GPS module. The wiring setup is illustrated below. Neo-6M GPS Module     |      ESP32 WROOM-32        Vcc      =====>   VIN (3.3V) GND   =====>     GND     TX      =====>    GPIO16     RX     =====>   GPIO17 Snapshot of the NEO-6M GPS Module used in this project: Front View of the NEO-6M GPS Module Backside of the NEO-6M GPS Module Snapshot of the ESP32 WROOM-32 Arduino board used in this project: After the interconnecting these two boards you have to follow following procedures. Install TinyGPS++ library: Open Ardui...

How to Create a New Virtual Machine on VMware Workstation Player | How to Install CentOS 8 Linux

This comprehensive video course series is dedicated to imparting essential skills in Linux server handling and web hosting. The primary goal is to offer a user-friendly and practical learning experience. The content delves into the intricacies of creating a virtual machine using VMware, providing step-by-step guidance on the installation process for CentOS 8. A significant aspect covered in this series is the exploration of package installations, including the crucial step of checking repositories. Through a blend of theoretical explanations and hands-on examples, viewers gain a solid foundation in server administration. The structured instructions ensure a seamless learning journey, enabling individuals to effortlessly follow and implement the demonstrated procedures.

How to Design and Simulate a 4-Phase Interleaved Boost Converter Using MATLAB Simulink

In this case study, I investigate the performance of a 4-phase interleaved boost converter using MATLAB Simulink. This type of DC-DC converter architecture is widely used in high-efficiency power systems due to its improved current sharing and reduced output ripple. Each phase of the converter is symmetrically designed using identical passive components: Inductors: L₁ = L₂ = L₃ = L₄ = 1.5 mH Capacitors: C₁ = C₂ = 200 μF The converter supplies an inductive load that draws a constant output current of 5 A. The input voltage is fixed at 30 V, and the converter is operated at a duty cycle (D) of 0.6. The primary simulation objectives are to analyze: The voltage gain of the converter, The output voltage ripple characteristics, And the phase current sharing behavior under these operating conditions. Simulink design of 4-phase interleaved boost converter Simulink inputs and output of design Through this design and simulation, the following steady state waveforms can be evaluated: Load voltage...

Scientific Writing - Research Article

  Significant sections of the Research Article How to write an Abstract? The abstract section is very important for the scientific paper because it represents all the contents briefly of a paper and the reader will decide whether or not to read the whole article. This is written by summarizing the introduction section. It has to briefly include the  problem, method, findings, and conclusion usually in the factual or past tense. How to write an Introduction? Start with a broad overview of the research scope. You have to provide a general background of the field or topic. Then you write a  literature survey about the topic. It does a critical analysis of the existing research on a specific topic. The next step is explaining a problem statement or research gaps . Then you can be writing  research objectives to provide the solution to the given problem statement or research gaps. Finally write scope and limitations that explain how the limitations may have affec...

Monitor Docker Services Using Grafana, Prometheus & cAdvisor — Without Touching the CLI

  If you're running Docker containers on a server, monitoring their performance using command-line tools can be time-consuming and difficult to visualize. In this guide, I’ll show you how to monitor your Docker services using Grafana, Prometheus, and cAdvisor—all through a web interface, without relying on CLI tools after setup. You’ll be able to: Track real-time Docker container metrics Visualize system performance through a Grafana dashboard Use Prometheus to scrape and expose container metrics Deploy everything using simple Docker commands Step 1: Run Your Docker Containers Make sure your Docker containers are already running. Here’s a snapshot of my currently active containers: Step 2: Install cAdvisor in a Docker Container To collect container metrics in real time, we’ll run cAdvisor inside a dedicated Docker container. Run the cAdvisor Container: sudo docker run   --volume=/:/rootfs:ro   --volume=/var/run:/var/run:rw   --volume=/sys:/sys:ro   --volume=/var...

Partitioning hard drives in Linux servers

ADDING PARTITIONS, FILE SYSTEMS, AND PERSISTENT MOUNTS The following flow chart indicates adding partitioning, file systems, and creating mount points for partitioning on Linux systems in a very short format and this is able to understand easily the complex process of Linux storage management. LOGICAL VOLUME MANAGEMENT (LVM) CONCEPTS The following flow chart indicates the LVM concepts very shortly on Linux systems.

What is a Network Operation Center (NOC)? Key Functions, Roles, and Benefits

A Network Operation Center (NOC) is a centralized facility where IT professionals monitor, manage, and maintain network systems around the clock. Acting as the command center for network performance and security, a NOC ensures seamless communication, stability, and efficiency across an organization’s infrastructure. NOCs are responsible for a range of critical tasks, including: Monitoring network devices and data flows Maintaining system health and software updates Troubleshooting and identifying network anomalies Rectification of errors and service disruptions Escalating issues to higher-level support teams Supervising and organizing system operations A NOC can be either internally managed by the organization or outsourced to a managed service provider (MSP). The choice depends on factors such as company size, network complexity, and operational budget. NOC Performances Metrics and KPIs Who Needs a NOC? Organizations with large-scale or mission-critical networks—such as telecom pr...

Innovative AI Frameworks for Controlling Plant Growth Parameters

Food is a fundamental necessity for human survival, leading to the expansion of crop cultivation beyond traditional rural areas into urban environments. Urban farming presents several advantages, including access to fresh, organic produce and the creation of new job opportunities. However, despite these benefits, urban agriculture faces notable challenges. Organic foods are often more expensive, and the success of urban farming initiatives can be hampered by insufficient space for plant growth, insufficient knowledge, inadequate conditions for plant growth, and significant environmental changes driven by global development. To address these challenges, this research focuses on leveraging Artificial Intelligence (AI) techniques to enhance urban farming practices. By applying AI, it is possible to optimize growing conditions, predict and manage plant needs, and adapt to changing environmental factors. AI can also help streamline operations and reduce costs, making urban farming more viab...

Different dates data plot on common x axis in 24-hour time frame using python.

Here, I used a different method to represent hourly data across various dates. I converted specific dates to common dates and then plotted the time series data on a 24-hour time frame along the x-axis, with traffic patterns on the y-axis.  import os import pandas as pd import numpy as np import matplotlib.pyplot as plt from datetime import datetime import matplotlib.dates import matplotlib.dates as md path = 'datasheet.csv' data = pd.read_csv(path) data.head() # Convert data to DataFrame df = pd.DataFrame({'Date&Time': data['Date'] , 'DL': data['DL']/1000000000, 'UL': data['UL']/1000000000}) # Replace all Date&Time with '02/02/2024' df['Date&Time'] = '02/02/2024 ' + df['Date&Time'].str.split(' ', expand=True)[1] # Convert 'Date&Time' column to datetime format df['Formated_Date'] = pd.to_datetime(df['Date&Time'], format='%m/%d/%Y %H:%M...